August 27, 2024 – Over the last two years, U.S. equities have staged a significant rally. During the month of July, the S&P 500, Nasdaq, and Dow Jones Industrial Average were all at or near record highs. And while early August saw some declines, they have all rebounded after a government report on consumer prices showed that the annual rate of inflation fell in July to a three-year low, solidifying the prospect of an interest rate cut at the central bank’s September meeting.1,2 However, there are real questions about whether stocks can continue rising in an environment with high interest rates, iffy consumer confidence and the uncertainty of a presidential election.3 But one thing is clear: stocks are pricey right now by historical averages.
Don’t take our word for it. Look at a reliable metric of overall market valuation called the Buffett Indicator. (It’s called the Buffett Indicator because the famed investor once called it the best measure of valuations, though he has since played down his enthusiasm for using only one measurement.)
We’ve written about the Buffett Indicator in the past, in early 2021 and again in late 2022, but given the recent run-up in stock prices, the topic is worth revisiting.A Look at the Numbers
The Buffett Indicator is based on simple math: total market cap divided by the gross domestic product (GDP). The ratio created is used to compare the overall value of public companies against the value of the goods and services they produce.
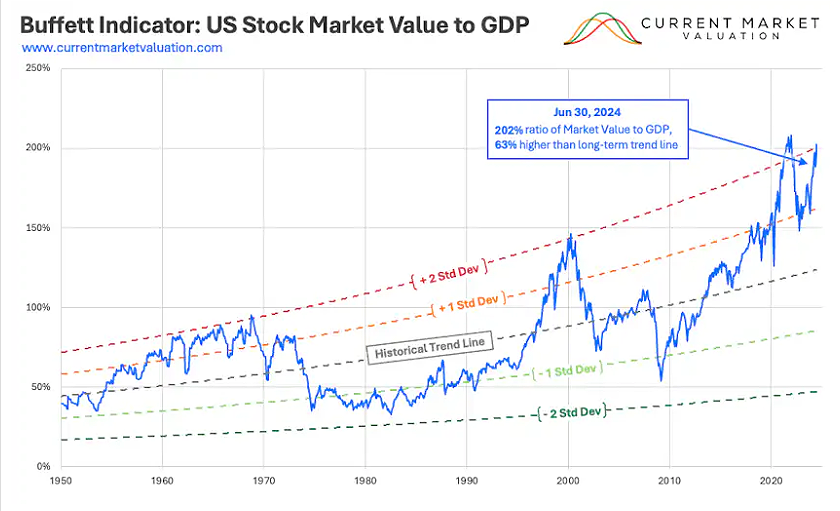
As a representation for the total market cap, the aggregate value of the Wilshire 5000 was $57.50 trillion as of late June. At that same time, GDP — stood at $28.42 trillion. Based on those two data points, the overall indicator stood at approximately 202%.4
Like most indices, this number doesn’t say much in isolation, but a story emerges if you look at how the number has shifted over time. From 1950 to the late 1990s, the metric remained below 100. It soared during the dot-com bubble, then fell sharply as stock prices corrected. It bottomed out again during the global financial crisis and has climbed steadily since then (with some short-term dips), far outpacing growth in U.S. GDP. In 2022, the indicator hit its all-time high of 211%. The following year, the S&P 500 declined by 19%.5 And as of June 2024, it was much higher than its historical average — 63.27% higher than the long-term trend line.4
For investors, this is one indicator that may underscore what you already know in your gut: stocks are expensive right now.

For illustrative purposes only and does not represent an investment. SOURCE: “The Buffett Indicator,” currentmarketvaluation.com, June 30, 2024.
A Reason for Diversification
To be clear, the Buffett Indicator is just one number (though it has a pretty good track record). Any assessment of market valuation should incorporate a range of data.
Also, it’s impossible to time the market, so clients who think they should buy or sell at a specific point in the market cycle are probably taking the wrong approach. Stocks are typically part of an overall investment plan for most investors. However, given that they have had a strong rally for the past decade — and especially over the past two years — future returns may be tempered as valuations return to something closer to historical norms.
Last — and perhaps most important — all asset classes are moving up and down in value all the time. That doesn’t mean one asset class is better than the others. It’s simply another reminder for your clients about the importance of diversification, a portfolio that includes a broad set of asset classes, including alternative investments. Diversification is a timeless approach that applies no matter what’s happening in the stock market.
1Brian Evans, “S&P 500 closes higher for fifth straight day as easing inflation bolsters rate cut hopes,” CNBC, Aug. 14, 2024.
2S&P 500 Index, Nasdaq and Dow Jones, Yahoo! Finance, Yahoo!, accessed Aug. 21, 2024.
3 Wayne Duggan and Farran Powell, “Stock Market Outlook for the Next 6 Months,” USA Today, June 13, 2024.
4“The Buffett Indicator,” Current Market Valuation, June 30, 2024.
5Nicole Goodkind, “Warren Buffett’s Favorite Market Indicator is Flashing Red,” CNN, March 27, 2024.
Represents CNL’s view of the current market environment as of the date appearing in this material only. There can be no assurance that any CNL investment will achieve its objectives or avoid substantial losses. Diversification does not ensure a profit or protect again loss. Indices mentioned above are for illustrative purposes only and provide general measure of equity market performance. Investors cannot invest directly in an index.
CSC-0824-3805052-INV

